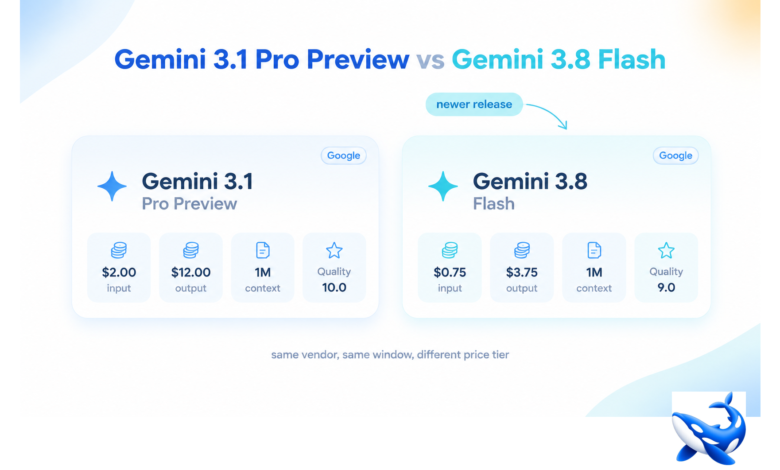
The usual assumption when two cards share a vendor is that the newer one sits above the older one in both price and capability. On OrcaRouter the Gemini 3.1 Pro Preview vs Gemini 3.8 Flash comparison breaks that assumption in an unusual direction: the newer card is the cheaper one, on both price lines, and it still trails the older card on our composite. This is a page where the version number on the label tells you almost nothing about the position on the ladder.
The two cards side by side
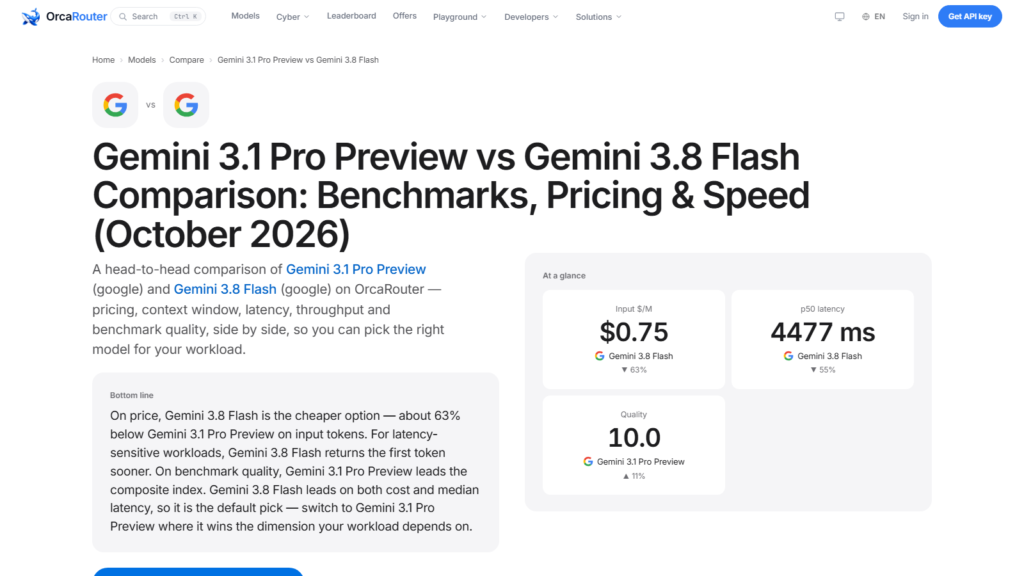
Read on 2026-10-13:
| metric | Gemini 3.1 Pro Preview | Gemini 3.8 Flash | gap |
| input, per million tokens | $2.00 | $0.75 | Flash is 2.7x cheaper |
| output, per million tokens | $12.00 | $3.75 | Flash is 3.2x cheaper |
| output-to-input multiple | 6.0x | 5.0x | Flash scales gentler |
| context window | 1M | 1M | identical |
| composite quality, 0–10 | 10.0 | 9.0 | Pro Preview leads by one point |
Both cards carry the same 1M context window, so capacity is not on the table here — this is purely a price-and-quality trade inside one vendor’s lineup. The Pro Preview card costs 2.7 times as much on input and 3.2 times as much on output, and its only measured return is one point of composite quality. The Flash card also has the gentler output multiple, 5.0x against 6.0x, which widens its advantage on any write-heavy workload rather than narrowing it.
Why the tier names point the wrong way
Two labels are doing work here and neither means what it looks like. “Pro” and “Flash” describe an intended position in a vendor’s lineup, not a measured outcome, and “Preview” is a separate claim entirely — it says the endpoint is a snapshot of a model that has not finished shipping. So the card on the left is the higher tier by name, the unfinished one by status, and the higher scorer by our composite. The card on the right is the lower tier by name, the later release by version number, and the cheaper one on both lines.
Our composite quality column is ours: a 0–10 figure computed from four families of evaluation we run against each endpoint — reasoning, code generation, long-context retrieval and instruction following — averaged into one number. It is not a third-party leaderboard and it cannot be reproduced on someone else’s harness. What it says here is narrow and worth stating precisely: on the four families we run, the higher-tier, unfinished card averages one point above the lower-tier, shipped one.
What one point buys, and what 2.7x buys instead
The honest reading of a one-point gap on a two-point-wide scale is that it is not noise — the whole twelve-model set we price spans 8.0 to 10.0, so a single point is half the total range. But this is also the case where the point is least likely to transfer to your workload, because the two models are not built for the same shape of job. Flash tiers exist to answer cheap, high-volume traffic with short outputs; the premium tier exists to answer harder prompts where the extra point is supposed to show up on reasoning-heavy work.
That means the pair does not resolve on the quality column alone. It resolves on which column your workload actually moves: if your traffic is mostly classification, extraction, routing and short-form generation, the one point sits on a capability that your workload never exercises, and paying 2.7x for it is paying for a number rather than an outcome. If your traffic is the kind that separates a 10.0 from a 9.0 — long multi-step reasoning, code synthesis that has to be correct on the first pass — the point is the whole purchase, and the price difference is the cost of it.
Same vendor, same window, two different bills
There is a structural fact about this pair that makes it easier to decide than most: the two cards agree on everything except price and score. Same vendor, same 1M window, same integration path, no difference in how the request is shaped or how the response comes back. Nothing about the surrounding architecture has to change to move between them, and nothing about compliance, region or vendor relationship tips the decision either way.
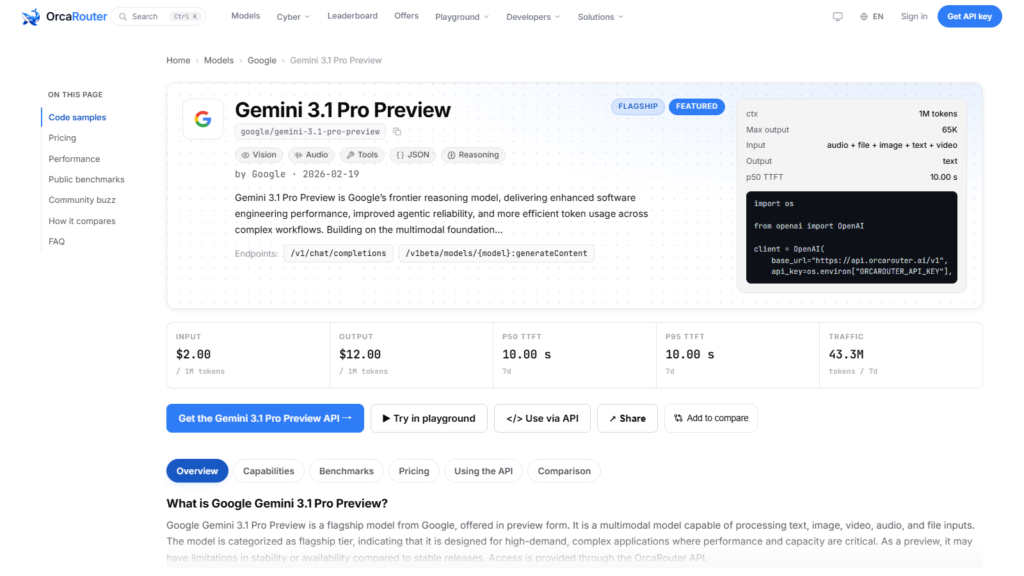
That uniformity turns the decision into a pure arithmetic question about volume. At $0.75 and $3.75, Gemini 3.8 Flash costs $4.50 to read and write a million tokens of each; at $2.00 and $12.00, Gemini 3.1 Pro Preview costs $14.00 for the same pair of transactions. The difference is $9.50 per matched million-token pair, and it scales linearly with volume — which means the point of quality has a price tag, and the price tag is a function of how much traffic you route.
The preview label is the other half of the decision
Set the score aside and the status difference remains. Gemini 3.1 Pro Preview is a preview: a snapshot its vendor has not finished shipping, subject to being superseded, and not guaranteed to behave identically under the same name next quarter. Gemini 3.8 Flash is a shipped release. For a workload you can re-run when a model changes, the preview status is a footnote; for a production path where a silent behaviour change means an incident, it is a cost that appears in no table on this page — and it lands on the more expensive card, which is the opposite of the usual arrangement.
Add the two together and the asymmetry is stark. The card that costs 2.7x more is also the card that carries the stability caveat and the higher output multiple. The only column where it leads is the composite, by one point, on a scale where the entire twelve-model field occupies two.
The takeaway
Both Gemini cards carry a 1M context window, so this pair is a price-and-score trade with no capacity angle. Gemini 3.1 Pro Preview costs $2.00 and $12.00 per million tokens and scores 10.0 on our composite; Gemini 3.8 Flash costs $0.75 and $3.75 and scores 9.0. The Pro Preview card carries a preview status and a harder 6.0x output multiple; the Flash card is the shipped release with the gentler 5.0x.
For high-volume, bounded work, Flash is the better buy by a wide margin, and the one point sits on a capability your workload will not exercise. For reasoning-heavy work where a single point at the top of the scale is the whole reason you are buying, Pro Preview is the card — but you are paying 2.7x for a point, on the more expensive side of a stability caveat, and that is the trade to make deliberately rather than by default.
Sourcing note: prices, context windows and output-to-input multiples were read off our own comparison page for this pair on 2026-10-13. The composite quality column is OrcaRouter’s own 0–10 scale, computed from four evaluation families we run against each endpoint, and is not a third-party index. The comparison page and the model page linked above are OrcaRouter production pages. All checked 2026-10-13.